GAZA AND WEST BANK — RECENT MAPS WITH IMPORTANT DATA
What I would like to see is a map that shows the roads, checkpoints, walls / barriers that have been built within these Palestinian territories.
Background added here, not part of the post as published.
The figures, checked against the agencies the graphics cite
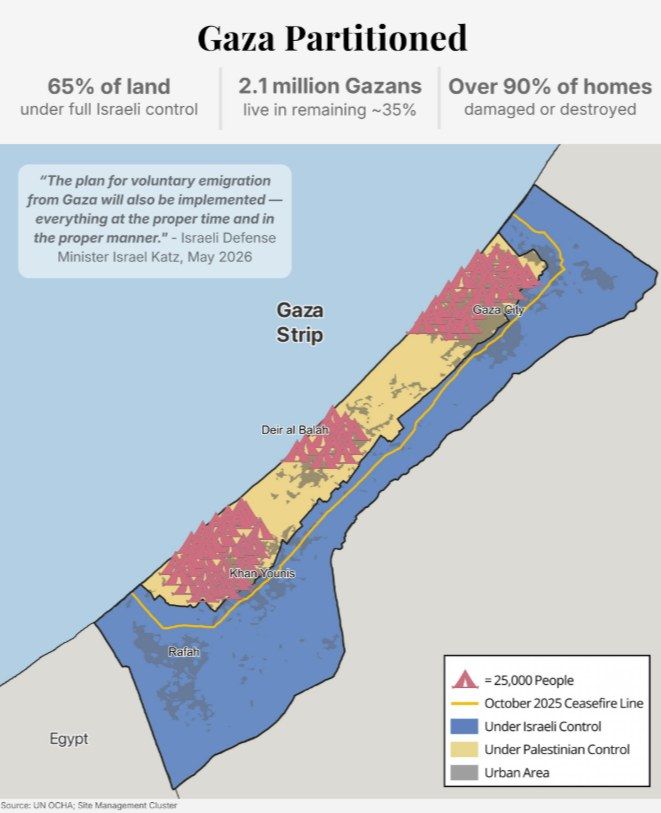
- Gaza, land. The October 2025 ceasefire left Israeli forces controlling about 53 per cent of the Strip along the “yellow line”. Reuters put effective control at 64 per cent; in May 2026 Netanyahu said control had reached 60 per cent and ordered it taken to 70. NPR’s analysis of restricted-access maps in July 2026 put it close to 70 per cent.
- Gaza, homes. OCHA and the Shelter Cluster put homes damaged or destroyed at 92 per cent. UNOSAT’s assessment of 11 October 2025 found 81 per cent of all structures affected — 198,273 structures, 123,464 destroyed, an estimated 320,622 housing units damaged. By August 2026 UNRWA reported about 82 per cent of structures, roughly 200,000 buildings, two thirds destroyed.
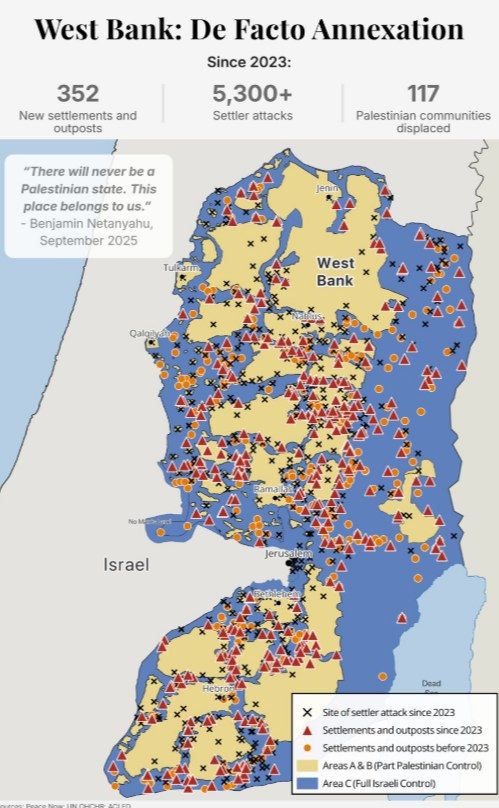
- Settler attacks. OCHA recorded over 5,330 since 2023 causing casualties, property damage or both — 1,291 in 2023, 1,449 in 2024, 1,835 in 2025, about six a day through 2026, the highest rate in records that begin in 2006.
- Displacement. OCHA counts 117 communities displaced in whole or in part between January 2023 and April 2026 — 45 fully, 72 partially, about 5,910 people. Human Rights Watch, on a different cut, reports 107 communities and 5,900 people.
- Settlements. Peace Now counts 102 new settlements declared by this government by 30 April 2026. New outposts ran at 26 in 2023 and at least 59 in 2024, against fewer than seven a year from 1996 to 2023.
The graphic’s figure of 352 new settlements and outposts since 2023 could not be tied back to a published count.
The map of roads, checkpoints and barriers — it exists
OCHA publishes it, with the count behind it. As at December 2025: 925 movement obstacles across the West Bank including East Jerusalem, restricting 3.4 million Palestinians — 43 per cent above the 647 annual average of the previous twenty years. The breakdown: 89 checkpoints staffed around the clock, 218 partly staffed, 232 road gates (159 frequently closed), 114 linear closures, 167 earthmounds, 105 roadblocks. Checkpoints and gates are now nearly 60 per cent of the obstacles, against 15 per cent two decades ago. Over 120 new road gates went in during 2025. Thirty-four of the 89 staffed checkpoints are in the H2 area of Hebron.
The Barrier: 712 km projected, about 465 km built, 85 per cent of its route inside the West Bank. Peace Now adds over 114 km of new settlement roads carved out in 2024 and NIS 7 billion allocated for settlement road infrastructure.
The maps are at OCHA’s Movement and Access fact sheet and its Barrier page.
The party position: Israel and Palestine, and Compare — Israel.