Australia’s Energy Future
At 30c/kWh an electric vehicle is three times cheaper to run than petrol. At 10c/kWh it is 8.9 times cheaper. Electricity and fuel are input costs inside every other price, and Australia imports 80 to 90 per cent of its transport fuel — so the lowest achievable electricity price is the cost-of-living policy, the fuel security policy and the emissions policy, in that order.
1. The numbers
- 80 to 90 per cent of Australia’s refined transport fuel is imported, on ships the country does not own. There are zero Australian-flagged fuel tankers on the register.
- The standing cost of that arrangement was about $59 billion a year in 2023, and rising.
- At 10c/kWh, an electric vehicle costs about $270 a year to run against $2,400 for the same driving on petrol — 8.9 times cheaper. At 30c/kWh the gap closes to roughly three times.
- Australia moves around 178 billion tonne-kilometres a year on semi-trailers, on diesel that is mostly imported. Road freight uses two to six times the energy of rail for the same task.
- One in twelve trucking businesses closed in a year, before the last fuel spike.
- China’s railway network reached about 162,000 kilometres by the end of 2024, roughly three quarters electrified. The International Energy Agency finds its electrified rail now saves more oil than the entire global electric vehicle fleet.
- Electric and plug-in vehicles passed 60 per cent of Chinese new car sales in 2026 — 62.9 per cent of retail sales in May — while purchase subsidies were being withdrawn.
- An EV charged on a coal-heavy grid produces 144 g CO₂/km. The Australian petrol fleet average is 191 g/km. The EV wins by 25 per cent on coal, and by 60 per cent on the current grid at 76 g/km.
- Light vehicles emit about 69 Mt CO₂ a year from exhausts, and heavy vehicles about 46 Mt. None of it is reached by putting more renewables on the grid.
- The government’s own projections miss the legislated 2030 target by 25 to 68 Mt and the 2035 target by 86 to 200 Mt. The named cause is transport, heavy industry and agriculture, none of which has a decarbonisation programme at the required scale.
2. The sequence
China’s new-vehicle share moved while purchase subsidies were being withdrawn, which indicates the driver was running cost rather than incentive.
The same variable applies in Australia. At thirty cents a kilowatt hour an electric vehicle is about three times cheaper to run than petrol. At ten cents it is 8.9 times cheaper. The running-cost advantage at ten cents extends to trades, delivery operators, second-vehicle households and light commercial fleets.
The stated order is therefore price first, then fleet turnover — without a target, a mandate or a purchase subsidy.
The ladder is arithmetic, at petrol around $2 a litre:
| Retail electricity | EV cost | Petrol cost | EV cheaper by |
|---|---|---|---|
| 30c/kWh — today | 5.4c/km | 16.0c/km | 3.0× |
| 20c/kWh | 3.6c/km | 16.0c/km | 4.4× |
| 15c/kWh | 2.7c/km | 16.0c/km | 5.9× |
| 10c/kWh — the target | 1.8c/km | 16.0c/km | 8.9× |
EV at 18 kWh/100 km, petrol at 8.0 L/100 km and $2.00 a litre. At 15,000 km a year, the annual fuel bill is $810 at 30c and $270 at 10c, against $2,400 on petrol.
Adoption by price step, as modelled: 25c high-mileage and rideshare operators; 20c small business and delivery fleets; 15c mainstream private buyers; 10c sufficient volume to populate the second-hand market, which is the entry point for low-income households.
3. What every switched vehicle actually does
A vehicle that moves from imported diesel or petrol to Australian electricity does four things at once, and only one of them is an emissions reduction.
- It cuts a household or business cost by the difference between $2,400 and $270.
- It cuts imported fuel, which is the single largest hole in Australia’s ability to supply itself.
- It raises productivity, because the input cost of moving goods falls for every business that moves them.
- It cuts emissions, as a by-product of the other three.
Three of the four effects are independent of any climate assumption. The fourth follows from the other three without a separate instrument.
4. Cost of living, at the source
Electricity and fuel are not two lines on a household budget. They are input costs inside every other line.
Fuel is around 30 per cent of a road freight operator’s costs, and every item in an Australian supermarket arrived on a truck. When diesel rose 67 per cent, that did not stay with the trucking industry — it went into the price of food, hardware, clothing and everything else that moves. One in twelve trucking businesses closed in a year, and the ones that survived passed the cost forward.
The same applies upstream. Irrigation is pumping. Refrigeration runs from the farm to the shelf and does not stop. Fertiliser, cement, steel, glass, aluminium and processed food are all made with electricity or with heat. The price of energy sets a floor under the price of nearly everything else.
A rebate is a one-off transfer: it changes no price and adds demand. Reducing the input cost lowers prices across the basket on a continuing basis, without a transfer and without a recurring budget line.
Sequence: electricity first, being the price directly addressable through generation, transmission and network regulation. Fuel second, since electricity price drives fleet conversion and fleet conversion reduces demand for imported fuel, which is the mechanism that reduces exposure to an internationally set price.
5. All methods, as China built it
China added generation of every type concurrently — coal, gas, hydro, nuclear, wind and solar — connected by the largest high-voltage transmission network in the world. The resulting surplus capacity and transmission headroom hold the wholesale price low.
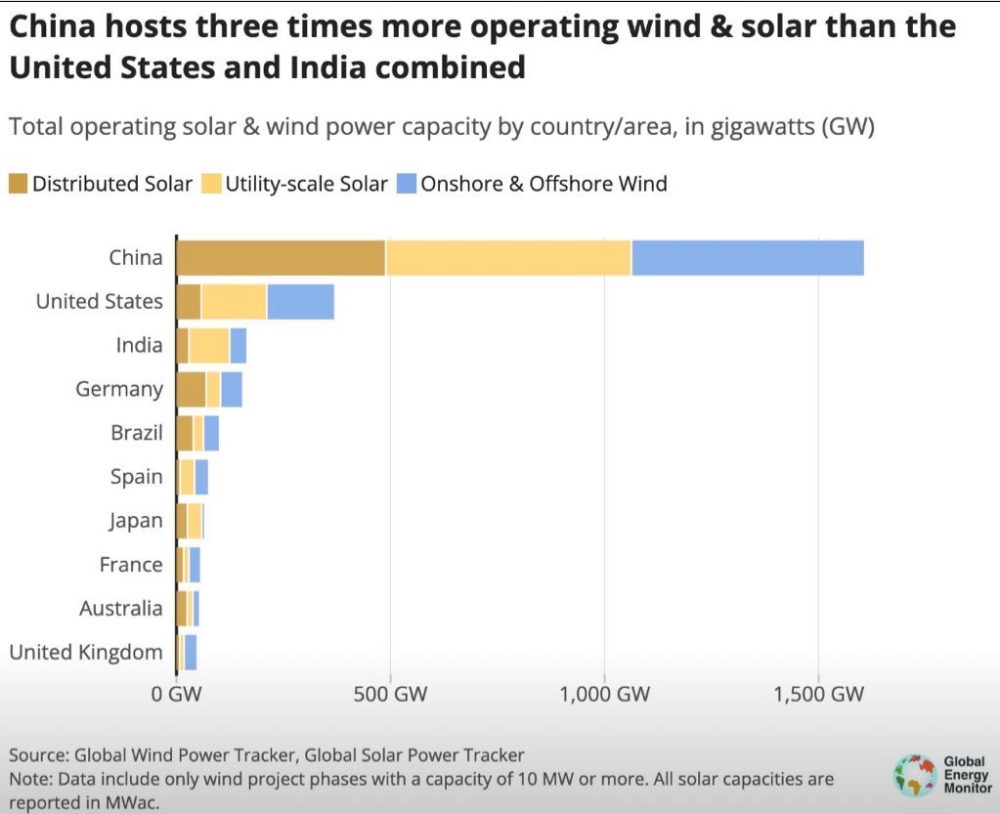
China built the largest renewable fleet in the world while continuing to add firm generation, and held the electricity price low enough to electrify the rail network and turn over the vehicle fleet over the same period.
The equivalent Australian build order:
- Continental solar at scale in the desert, where the resource is best and the land is not competing with anything.
- An HVDC national backbone, carried on the corridor structure being built anyway for freight and passenger rail, connecting the desert generation to the coastal load.
- Pumped hydro storage to firm it, sited at the corridor hub.
- Gas and coal generation running throughout, providing the firm capacity that keeps the price low and the lights on while the build proceeds.
6. Coal and firm capacity
The test is a price, not a fuel. Whatever delivers ten cents a kilowatt hour gets built. Nothing is excluded by category and nothing is protected by category.
That means no legislated closure dates, and it also means new firm capacity where new firm capacity is what holds the price down. If the cheapest way to keep power at ten cents through the build is coal, coal is what gets built. If it is gas, gas. If it is desert solar with storage, that. The decision is made on delivered cost per kilowatt hour and nothing else, and it is made in public with the numbers published.
The same test retires plant. Generation closes when it is undercut commercially, on a date the market sets rather than a date a parliament announces.
The emissions arithmetic follows. An electric vehicle charged on a coal-heavy grid produces about 144 grams of CO₂ a kilometre. The Australian petrol fleet average is 191 grams. The electric vehicle wins by a quarter on coal, because an electric drivetrain converts energy to motion at above 90 per cent efficiency against 25 to 30 per cent for combustion. On the current grid it produces 76 grams, and it improves every year the grid improves — with no trade-in and no new purchase. The petrol car bought today emits at its rated figure for as long as it is driven.
Light vehicles emit about 69 million tonnes a year from exhausts, and no amount of renewable generation reaches any of it. A perfect renewable grid that nobody drives an electric vehicle on saves nothing in transport. Firm capacity holding power at ten cents while the fleet electrifies displaces more emissions than it produces. Early closure of firm capacity raises the electricity price, which slows fleet conversion and extends the period over which imported liquid fuel is burned.
7. Freight
Heavy vehicles emit about 46 million tonnes a year and burn the largest single block of imported diesel in the country. Electric rail is three to four times more energy-efficient per tonne-kilometre than diesel rail, and roughly ten times more efficient than road freight.
The truck economics move on the same price. Diesel for a B-double runs about 60 to 80 cents a kilometre in fuel alone; at ten cents a kilowatt hour the electric equivalent is about 15 to 20 cents. On a vehicle covering 500,000 kilometres a year that is $200,000 to $300,000 a year saved per truck, and the purchase premium pays back in two to three years. The requirement is cheap electricity and charging along the corridor, both of which the corridor build provides without a separate programme.
Road freight is retained for the fifty to two hundred kilometre run between rail terminal and farm, mine or port — a range within current electric truck capability.
8. Where it goes
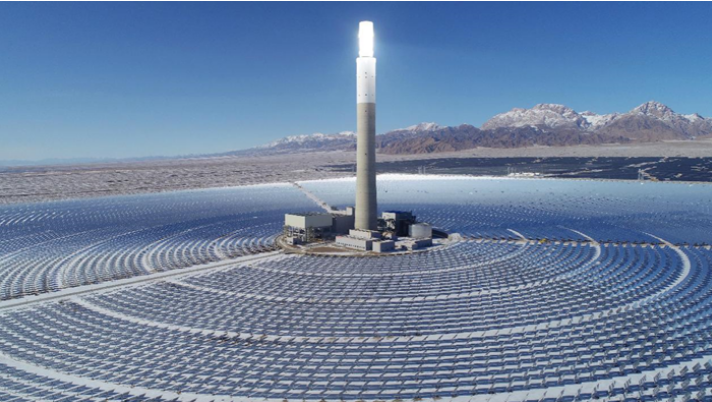
Solar, wind and transmission belong in the desert, not on farmland. The interior resource runs at 2,400 to 2,800 kilowatt hours per square metre a year against 1,600 to 1,800 in the coastal zones currently being developed. It is largely Crown land, with no residential communities in the transmission path and no competing agricultural use.
Transmission costs have risen 25 to 55 per cent in real terms since 2022, with delivery rather than technology identified as the binding constraint. Siting generation in the interior and carrying transmission inside the corridor removes the land-access and community-objection path from the critical path. The corridor is built for freight and passenger rail regardless, so the marginal cost of adding cables is a fraction of a standalone line.
Farmland remains in production, and a single corridor easement carries transmission, freight, water and fibre.
9. One build, not six programmes
Everything above sits on a single piece of infrastructure. The corridor being built for freight and passenger rail carries the HVDC cables, the water, the gas and the fibre inside the same structure. The transmission is therefore a marginal cost on a build that is happening anyway, rather than a standalone line negotiated easement by easement.
At maturity that means about 1,000 GW of desert solar firmed by 40 GW of pumped hydro at the corridor hub — more firm dispatchable capacity than Australia’s entire current coal fleet.
The current project-by-project approach is delivering as follows. HumeLink has run 190 per cent over, from $1.1 billion to $3.3 billion. Marinus Link 250 per cent, from $1.1 billion to $3.8 billion. Project EnergyConnect 84 per cent, from $2.23 billion to $4.1 billion. Five major transmission projects are running at roughly 140 per cent combined overrun, years late, and contested at community and state level. On freight the position is worse: Inland Rail cancelled its northern half in 2025, and what was completed is diesel-only on a network cut by floods three times in four years.
One structure carrying six services replaces six programmes each acquiring its own route.
10. And it is the defence policy
Australia imports 80 to 90 per cent of its refined transport fuel on foreign-flagged ships through a small number of maritime chokepoints. Naval capability protects shipping; it does not remove the dependency. The party’s stated defence doctrine treats supply interruption, not invasion, as the primary vulnerability.
Domestic electricity substitutes for imported fuel at the point of use. Each vehicle and each tonne of freight converted removes a corresponding quantity of imported fuel from the shipping task. The energy programme is therefore also the mechanism that reduces the dependency.
The party’s position is that self-reliance measures — fuel reserves, domestic industry and continuity of supply under interruption — increase Australian security without reducing a neighbour’s, and so do not trigger a reciprocal arms response. The build draws on the same shipyards and engineering workforce already funded through defence procurement.
11. Export, and the industry that builds it
Reducing fuel imports addresses domestic supply. Surplus generation is exported. At maturity the programme exports roughly 82.5 GW continuous — about 650 terawatt hours a year — into Asia-Pacific grids over seven subsea corridors totalling around 32,500 kilometres, each carrying HVDC electricity and fibre as standard, with gas, hydrogen or water added where a destination wants them. The Darwin–Singapore leg follows the Sun Cable alignment already approved by both governments.
Unlike mineral exports, the resource is not depleted by sale, and delivery requires manufactured infrastructure rather than extraction alone.
The global fleet of HVDC cable-lay vessels numbers fewer than two dozen ships. A network this size needs its own, which means building them here. Eight capability streams are required: cable and service-line manufacturing, vessel construction, heavy fabrication, the marine engineering workforce, converter stations and transformers, subsea connectors and joints, survey and ROV services, and pipeline laying.
Australia does not have to commission a new industrial base for any of it. It uses the one AUKUS is already commissioning. Repositioning the programme does not waste that investment — the dockyards, the heavy fabrication, the trained workforce and the bilateral supplier relationships all stay. What changes is the output mix. Cable-lay and pipeline-lay vessels are civilian dual-use output from the same yards, built by the same people, between defence taskings. Heavy fabrication runs at Newcastle, Whyalla and the Australian Marine Complex at Henderson.
The efficiency comes from building the land and subsea programmes off one base. The same production line makes land transmission cable and subsea export cable. The same steel line makes continental pipeline and subsea pipeline. The same converter assembly serves land substations and subsea landing stations. That cross-use is what delivers the programme’s 95 per cent sovereign content target at scale — Australian materials, Australian labour, Australian production lines.
The workload is continuous with no defined endpoint, which addresses the utilisation gap that follows the completion of a defence procurement cycle: the same facilities build corridor infrastructure, export network components and merchant vessels.
12. Net zero, as an outcome
Everything above delivers the emissions reduction that current policy is trying to legislate into existence: transport electrified, freight moved to rail, generation progressively replaced as it is undercut, and industry supplied at a price that keeps it here rather than exporting it to a dirtier grid.
The ledger at programme maturity: about 275 to 325 Mt a year retired and sequestered domestically — roughly 140 from the grid, 80 to 100 from transport, 20 to 30 each from industrial process heat and from mining and agricultural diesel, and 15 to 25 from a billion trees planted on aqueduct water. That hits the 2030 target on time and lands 2035 on schedule.
A further 455 to 585 Mt a year is displaced offshore, because clean Australian electricity arriving in an Asia-Pacific grid is dispatched ahead of that grid’s own coal by merit order. Coal plants in Indonesia, Vietnam and the Philippines physically run fewer hours. The reduction is physical rather than a credit transaction. The party’s position is that Australia negotiate Article 6 bilateral agreements to apportion the credit with host nations rather than claim it unilaterally.
And the residual is named rather than offset away: about 145 to 195 Mt remains at 2050 — fugitive emissions from legacy fossil operations, agricultural emissions outside the programme, and hard-to-abate industrial chemistry. That is approximately 60 per cent of the legislated 2050 trajectory delivered through physical infrastructure, with the remaining 40 per cent stated as an unresolved engineering problem rather than assigned to offsets.
Renewable generation is forecast to become the lowest-cost option in Australia, on the basis of resource quality and observed cost trends. That forecast is not a policy dependency. The rule is the price. If renewables deliver ten cents, they are built. If firm fossil capacity holds ten cents during the build, it is built, and retires when undercut. The outcome — low electricity price, electrified fleet, declining emissions — does not require the forecast to be correct.
Net zero is what the policy produces. It is not the argument for the policy. The argument is cheaper power, cheaper transport, fewer fuel imports and higher productivity — and those hold for every voter, including the ones who have stopped listening to the other version.
13. Summary
Energy is an input cost in every good and service, so the price of power sets a floor under the price of nearly everything. Lower it and the whole basket falls, without a transfer and without a budget line renewed each year.
Ten cents a kilowatt hour, legislated as a maximum. Then build whatever delivers it — desert solar, an HVDC backbone, pumped hydro storage, and firm coal and gas capacity where firm capacity is what holds the price, each retiring when it is undercut. Freight to electric rail. Generation off farmland.
The fleet then turns over on economics, as it did in China while subsidies were being withdrawn. Imported fuel falls with it, the standing $59 billion bill falls with that, and emissions fall as a consequence rather than as an instruction.
One structure carries the transmission, the freight, the water and the fibre, so the transmission is a marginal cost rather than a separate programme negotiating its own route. And the same build closes the country’s largest strategic weakness, because fuel that is generated inside the continent cannot be cut off outside it.
The surplus is then exported by cable into the region, on vessels and cable built here, using the industrial base defence spending is already funding. The same production lines serve the continental build and the export network, which is what makes 95 per cent sovereign content achievable at programme scale.
14. Sources
- Sovereign Australia Party, Australia’s Energy Future (Memo 15, v1.0, 26 July 2026) — 80 to 90 per cent of refined transport fuel imported and zero Australian-flagged fuel tankers on the register; the approximately $59 billion annual standing cost of the arrangement in 2023; the 8.9-times running-cost advantage of an electric vehicle at 10c/kWh, being about $270 a year against $2,400 for the same driving; approximately 178 billion tonne-kilometres a year moved on semi-trailers; road freight energy intensity at two to six times rail for the same task; one in twelve trucking businesses closing in a year before the fuel spike; China’s railway network at about 162,000 kilometres by the end of 2024 with roughly three quarters electrified and the International Energy Agency finding its electrified rail saves more oil than the entire global electric vehicle fleet; and electric and plug-in vehicles passing 60 per cent of Chinese new car sales in 2026, at 62.9 per cent of retail sales in May, while purchase subsidies were withdrawn. Cited in sections 1 to 6 and 11.
- Sovereign Australia Party, Power Prices (op-power) and Energy & Net Zero (op-energy) — the legislated maximum of 10 cents a kilowatt hour for households and small business by the end of the first term, stated as a cap rather than an aspiration, with 6 cents industrial at corridor maturity; no legislated coal closure dates, with coal generation running until undercut commercially; and net zero treated as an outcome of the build rather than as the argument for it. Cited in sections 2, 5 and 10.
- Modern Movement Australia, Energy, Freight and The Plan — continental desert solar; the HVDC backbone carried on the corridor structure built for freight and passenger rail; pumped hydro firming at the corridor hub; sub-10c/kWh consumer electricity; electric heavy freight with the road task reduced to the fifty to two hundred kilometre run from rail terminal to farm, mine or port; and siting of generation and transmission away from productive farmland. Cited in sections 4, 6 and 7.
- Modern Movement Australia, The Coal Paradox (MMA Memo 12, 15 May 2026) — an electric vehicle on a coal-heavy grid at 144 g CO₂/km against an Australian petrol fleet average of 191 g/km, and 76 g/km on the current grid; the electric drivetrain above 90 per cent efficient against 25 to 30 per cent for combustion; light vehicle emissions of approximately 69 Mt and heavy vehicle emissions of approximately 46 Mt a year, neither reached by grid decarbonisation; the running-cost ladder from 3.0× at 30c/kWh to 8.9× at 10c/kWh and the annual figures of $810, $270 and $2,400; the adoption sequence by price milestone and the second-hand market effect; electric semi-trailer fuel costs of 60 to 80 cents a kilometre on diesel against 15 to 20 cents at 10c/kWh, being $200,000 to $300,000 a year on a 500,000-kilometre vehicle with a two-to-three-year payback; electric rail three to four times more efficient than diesel rail and roughly ten times more efficient than road freight; and coal exiting on price rather than legislation. Cited in sections 1, 2, 5 and 6.
- Modern Movement Australia, Three Plans, One Grid (MMA Memo 11, v1.1, 24 July 2026) — the interior solar resource at 2,400 to 2,800 kWh/m²/year against 1,600 to 1,800 in the coastal renewable energy zones; transmission costs 25 to 55 per cent higher in real terms than 2022 with delivery the binding constraint, per the AEMO 2026 Integrated System Plan of 25 June 2026; the CSIRO GenCost 2025–26 Final Report of 15 July 2026 putting the full net-zero pathway at $141 to $152 a megawatt hour including transmission, and the retail bill split of approximately 33 per cent generation, 7 per cent transmission and 35 per cent distribution; coal wholesale at 8 to 12 cents a kilowatt hour against desert solar delivered at 4 to 7 cents; and the geographic argument that building generation near people rather than near the sun drives most of the cost and most of the opposition. Cited in sections 1, 4, 5 and 7.
- Modern Movement Australia, The Net Zero Path to 2050 Target (MMA Memo 25, 22 May 2026) — the Department of Climate Change projections missing the legislated 2030 target by 25 to 68 Mt and the 2035 target by 86 to 200 Mt, with transport, heavy industry and agriculture named as the structural cause; approximately 1,000 GW of desert solar and 40 GW of Alice Hub pumped hydro; the domestic ledger of approximately 275 to 325 Mt a year (grid ~140 Mt, transport 80 to 100 Mt, industrial process heat 20 to 30 Mt, mining and agricultural diesel 20 to 30 Mt, billion-tree sequestration on aqueduct water 15 to 25 Mt); international displacement of approximately 455 to 585 Mt a year through merit-order dispatch of Australian electricity arriving in Asia-Pacific grids; the residual of approximately 145 to 195 Mt at 2050 named openly rather than offset; the Article 6 bilateral credit-sharing position; and the transmission and freight delivery record — HumeLink at a 190 per cent cost overrun from $1.1bn to $3.3bn, Marinus Link 250 per cent from $1.1bn to $3.8bn, Project EnergyConnect 84 per cent from $2.23bn to $4.1bn, five major projects at roughly 140 per cent combined overrun, and Inland Rail cancelling its northern half in 2025 with the completed southern segment diesel-only. Cited in sections 1, 8 and 10.
- Sovereign Australia Party, Defence — Not Attack (op-defence) and Modern Movement Australia, The Prize: A Unified AsiaPac — the Castle Defence doctrine, that a nation which can be starved does not need to be invaded, and that self-reliance is the one form of security that raises a nation’s safety without lowering a neighbour’s; and the dual use of the shipyards and engineering workforce that defence spending already funds. Cited in section 9.
- Modern Movement Australia, The Asia-Pacific Subsea Corridor Network (MMA Memo 26) and The Subsea Industrial Base (MMA Memo 27, 23 May 2026) — seven subsea multi-service corridors totalling approximately 32,500 kilometres, each carrying HVDC electricity and fibre as standard with gas, hydrogen or water optional, and the Darwin–Singapore leg on the Sun Cable alignment approved by both governments; the global HVDC cable-lay fleet numbering fewer than two dozen vessels; the eight capability streams required for delivery (cable and service-line manufacturing, vessel construction, heavy fabrication, marine engineering workforce, converter stations and transformers, subsea connectors and joints, survey and ROV services, pipeline laying) and the AUKUS-foundation overlap for each; cable-lay and pipeline-lay vessels as civilian dual-use output of the repositioned programme, with the industrial base, workforce and bilateral supplier relationships retained and only the output mix changed; heavy fabrication at Newcastle, Whyalla and the Australian Marine Complex at Henderson; the cross-utilisation of a single cable production line for land and subsea cable, a single steel line for continental and subsea pipeline, and a single converter assembly for land substations and subsea landing stations; the 95 per cent sovereign content target delivered by that cross-use; and the continuous multi-decade load that keeps the hub operating after the initial defence procurement cycle. Cited in section 10.
Further reading — Modern Movement Australia
The engineering and modelling behind the positions in this memo are set out in full in the following Modern Movement Australia memos.
- The Coal Paradox and the EV Transition — the 144 g/km against 191 g/km arithmetic, the running-cost ladder from 30c to 10c, and the freight economics.
- Three Plans, One Grid — the Coalition, Labor and corridor pathways compared on cost, deliverability and land use, with the interior solar resource and transmission cost record.
- The Net Zero Path to 2050 Target — the full emissions ledger: domestic retirement, offshore displacement by merit order, and the named residual.
- The Asia-Pacific Subsea Corridor Network — the seven corridors, routes, capacities and the destination markets.
- The Subsea Industrial Base — the eight capability streams, the AUKUS-foundation overlap, and the sovereign content model.
- The Prize: A Unified AsiaPac — the regional and strategic case the export network sits inside.